Credit spreads as represented by the US CDX and European Main investment grade indices, and the Aussie iTraxx have been widening since the end of the first
quarter of 2015 but a sharp turnaround is now evident as market participants formed a view that the sell-off has been over-done. Chart 12 below confirms that the change in direction for credit spreads came in mid-February.
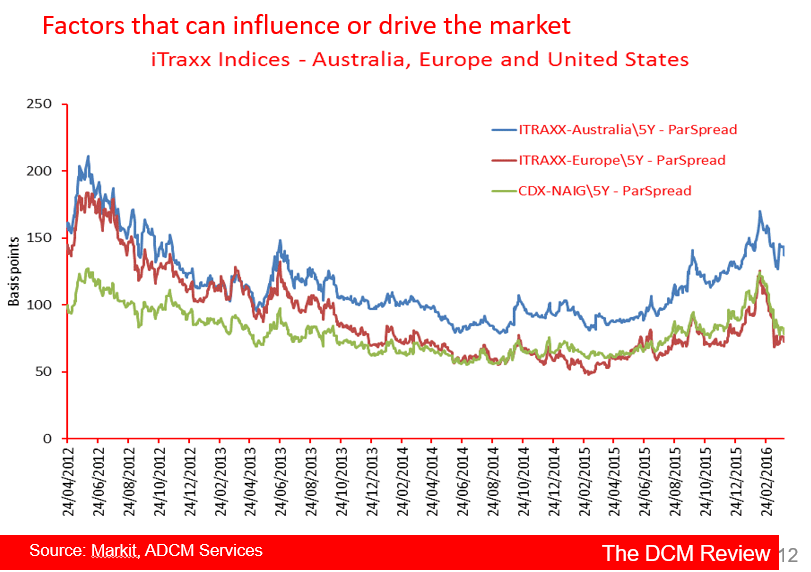
Chart 12 Credit Spreads
It appears that a second turnaround occurred in the Aussie iTraxx in mid-March but this stems from the roll of the index to Series 25, from Series
24. A change in index constituents, which saw Goodman Funds Management replaced by Qantas Airways, accounts for much of the movement.
The narrowing trend has since resumed but a poor start to the second quarter brings its continuance into question.
Chart 13 has become interesting again as the high correlation between movements in the Chinese sovereign CDS index and the Aussie iTraxx has reappeared.
The correlation was very strong in the second and third quarters of 2015 - peaking at 96% at the end of September, but disappeared in the fourth quarter.
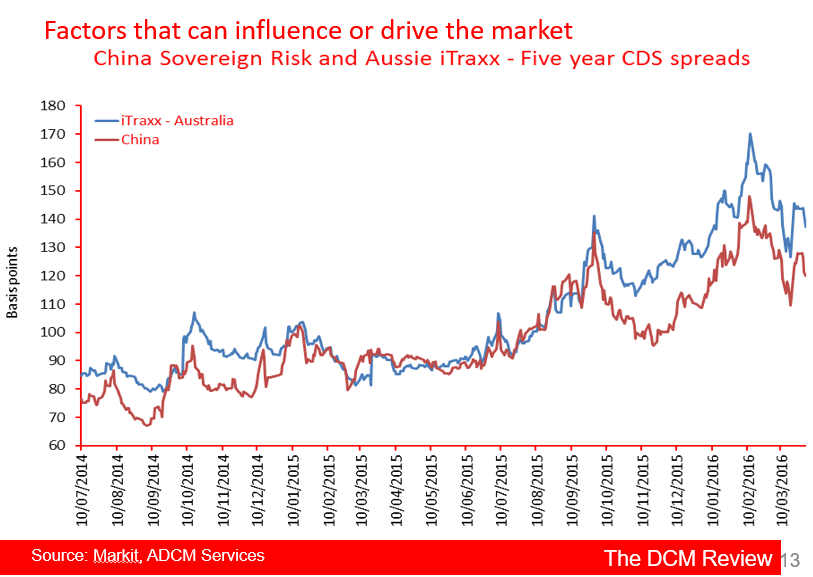
Chart 13 Chinese Sovereign CDS index and the Aussie iTraxx
However, the correlation over the full year from the end of the first quarter of 2015 is running at 93%. Thus the credit quality of the 25 Australian companies that comprise the index will be determined by events in China. Cause and effect is unlikely to run the other way.
To provide more context, Chart 14 shows that CDS spread movements for BHP Billiton have been a major driver of the performance of the Aussie iTraxx index, and those of the major banks have also contributed.
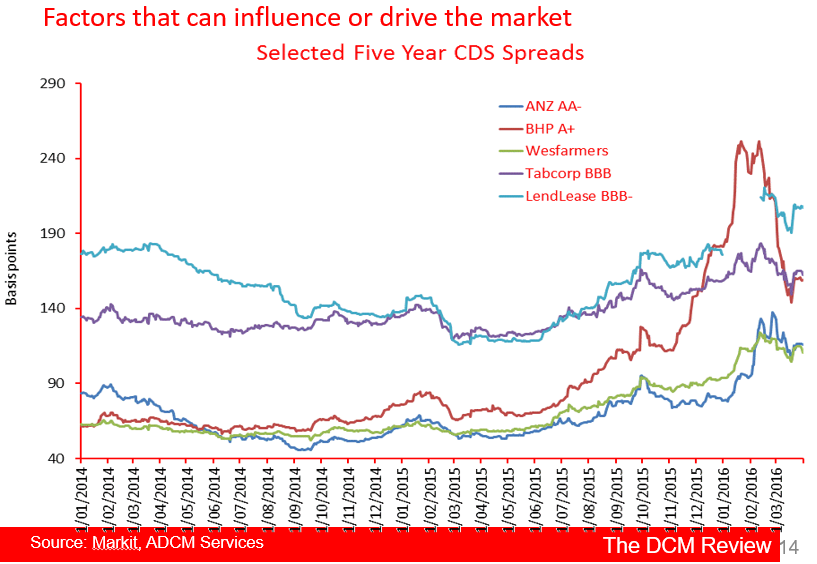
Chart 14 Selected CDS Spreads
Increasing corporate bond yields and widening credit spreads dampened issuance activity in the first quarter, especially in the domestic bond and
securitisation markets, but less so in the case of international bond issuance.
International bond issuance is running only marginally behind where it was at the same time last year. The US market has been favoured slightly more
than the Euromarket. And of course, issuance by (major) banks has dominated – see Charts 16 and 17.
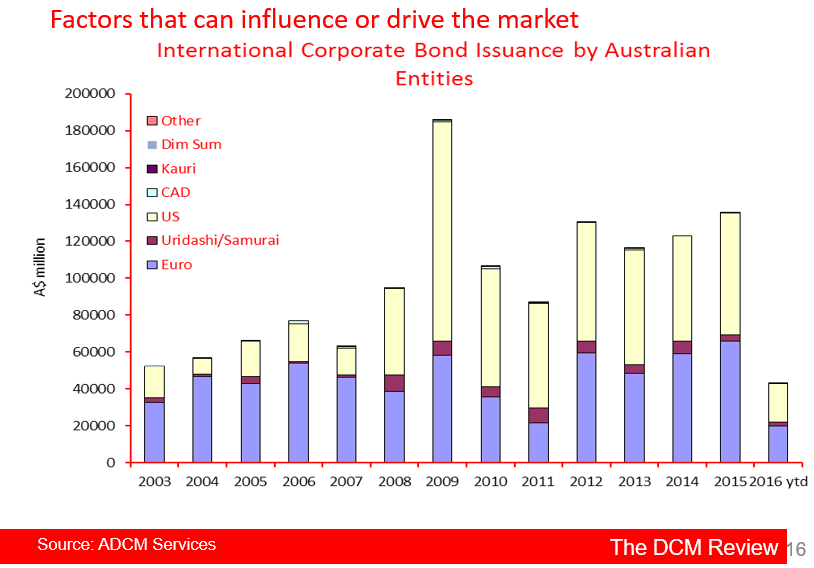
Chart 16 International Bond Issuance
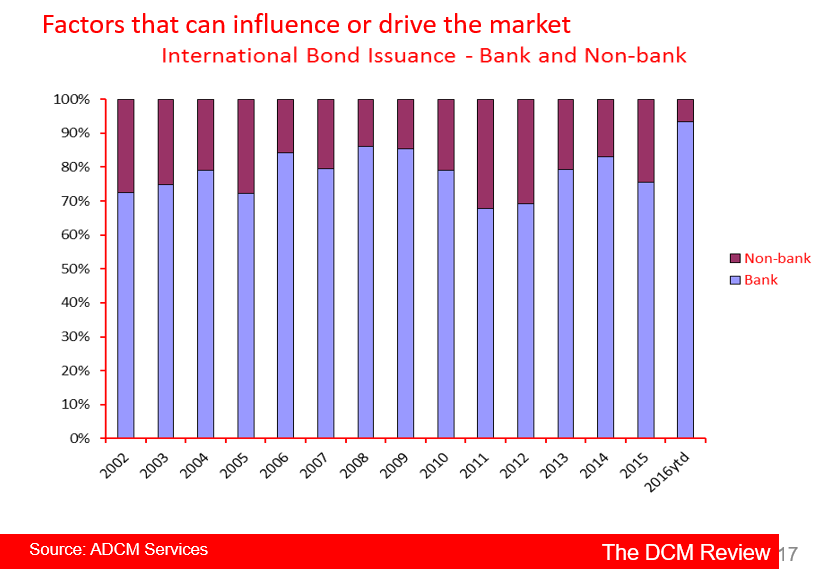
Chart 17 International Bond Issuance - Bank & Non Bank
Securitisation has got off to its worst start since 2012. In that year, issuance didn’t get underway until March and the total for the year came in
at a relatively paltry A$21.6 billion.
This year issuance started in late February and continued steadily into March but with credit spreads on primary issuance noticeably wider than where
they ended 2015, volumes have been modest and are likely to stay that way – see Chart 21.

Chart 21 Australian Securitisation Issuance
The domestic corporate bond market has fared only marginally better. With the exception of two small non-FI issues brought to the market by FIIG Securities,
there has been no non-FI issuance in the first quarter of the year.
This has not happened since the GFC, and speaks to the structural change in the market that can no longer be denied.
In any event, issuance in the first quarter is in-line with that in the first quarter of 2009. While 2009 went on to be the best year the market has
yet seen, the same outcome is not expected for this year – see Chart 26 below.
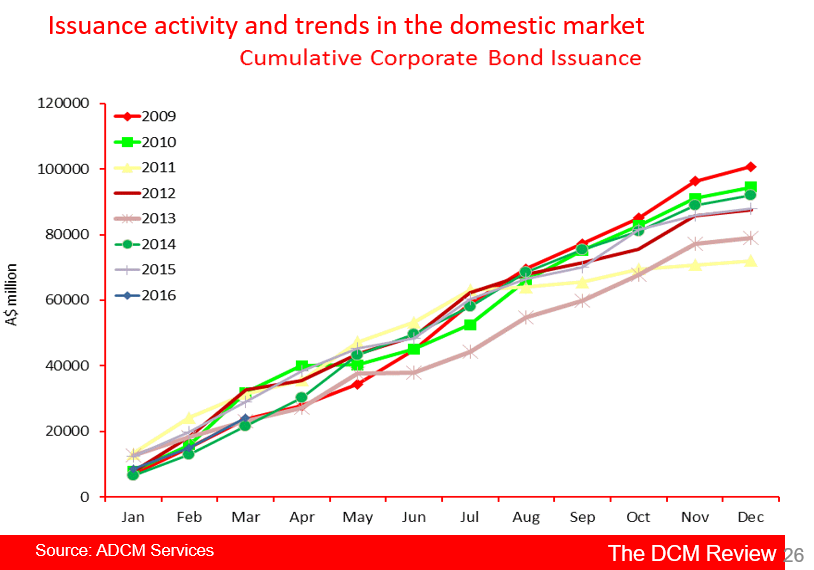
Chart 25 Cumulative Corporate Bond Issuance
Chart 25 below shows that monthly issuance volumes have been trending downwards since mid-2015.
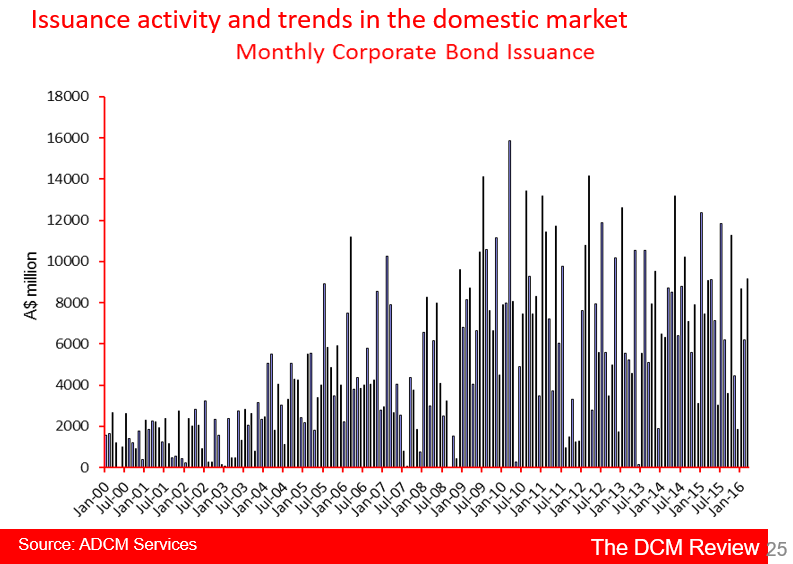
Chart 25 Monthly Corporate Bond Issuance